Identify calls: Better measure thrice
22. Februar 2024
We are using self developed measurements already since 2005 to describe bat calls. These exceed the usual parameters by far and can be extracted with a simple and reliable algorithm with blazing speed. These measurements have proven to be useful for identifying bat species in our software tools (bcDiscriminator, batIdent). Nevertheless we have identified differences in suitability according to the call types. These are mostly already used knowingly or accidentally when manually measuring calls. We have adopted some of them and created a couple of new unique measurements.
Please, don't worry. We are not going to explain in detail our 180 measurements here.
Examples of measurements
The list of our already established measurements included some, that were already very robust against measuring inaccuracy. Many of our measurements are derived from the extraction of the call slopes and were stored in histogram bins of 1 kHz width (2 kHz above 100 kHz). From this the value FMod (modal frequency) was extracted, describing the frequency bin with most counts. NMod gives the actual number of measurements in this FMod class. This is comparable to the frequency measurement of highest spectral energy yet it can be calculated without any side effects introduced by FFT algorithms. Another value that is well working is the Flastms or frequency of the last millisecond. These are especially valuable if calls have qcf parts in their second half. For frequency modulated calls these aren't as good, but slope values or steepness might be more interesting.
Slopes and bends - the new heroes ?!
When identifying bat calls within genus Myotis manually, we often look at the slopes and various bends. Most prominent the last bend within the call and its frequency. These points of interest can all be described using actual gradient values within parts of the call. When the gradient changes, you have a bend to measure. This procedure can be easily automated based on the call measurements we already take. Now we have the actual slope value, an angle value and the frequency of such characteristic parts of a call. The image shows these for two values, Fknee and Fmk with corresponding slopes.
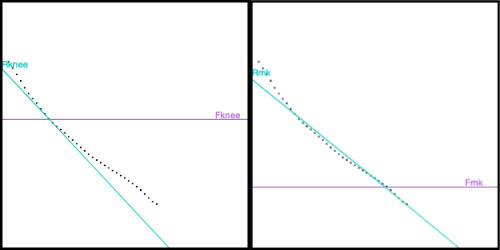
Since it is so easy and useful, we also measure a couple of other such slope values with their corresponding frequencies. We added for example frequency at lowest slope or slope at middle of call bandwidth. And from all these we can calculate derived values and for example determine the call type (fm, fm-qcf, qcf) automatically.
Measurements and variance
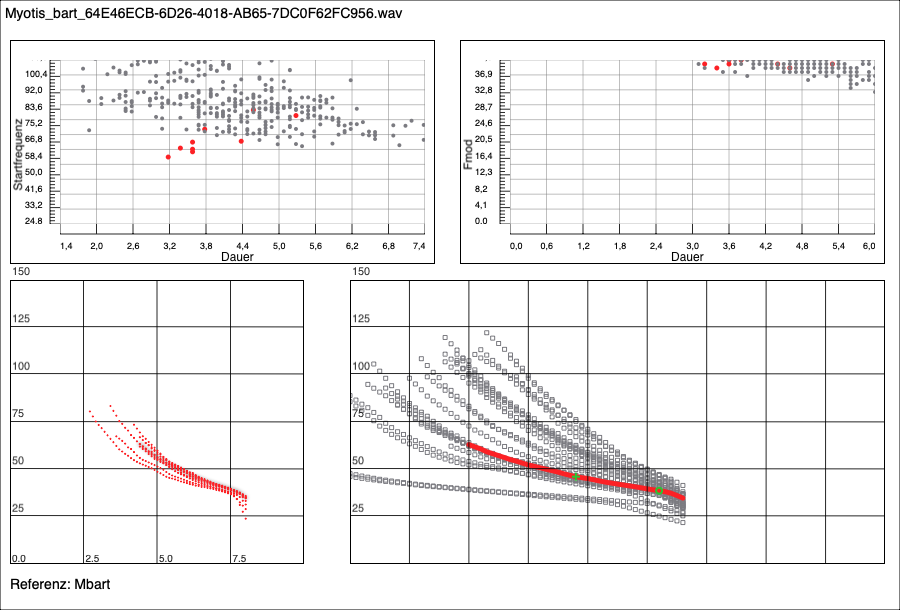
To identify species based on their calls measurements of call parameters are used. We already have shown some of these. Most users quickly realize that some of these parameters are rather stable. Like for example main frequency of pipistrelles bats. Other parameters scatter wildly - as seen in starting frequencies of Myotis species. While sometimes bats deliberately adjust calls in a wide range often technical or physical properties lead to a high deviation of a parameter. best example again Myotis starting frequencies with high frequencies getting less well recorded. To understand such effects we do look at many parameters in terms of scatter. As for example starting frequency versus duration in the following plots.

An other example is frequency within last millisecond (Flastms) versus duration. Genus specificity can be seen here.

Normal deviation or just a bad recording?
A modell for classifying species based on call traits needs to be trained in such a way the typical deviation of call parameters is included. At least, if the deviation is caused by the bat actively. Scatter due to low quality recordings is not helpful in training. Yet, later in your daily work, many recordings will have bad quality calls. So to some extent the training needs to be sensitive for such recordings. As a user you always should be aware that bad recordings may not be classified well. An example of calls of a brandt's myotis with most calls missing large parts.